
An Exercise in Equity and Efficiency of a Lottery
As an Associate Fellow with the Office of Evaluation Sciences, I’ve had the opportunity to collaborate on a series of projects linked to the distribution and impact of pandemic relief for small businesses. One such project that some brilliant researchers on our team spearheaded centered on the distributional consequences on different financial award disbursement mechanisms.
To do this, one might anticipate that these researchers did a standard regression analysis to assess how business, and business owner, characteristics led to disparities in access. However, this approach is limited in one key respect: endogeneity. It is impossible to know whether unobserved factors (factors that just couldn’t be measured because of limited availability of data) were the true cause of observed disparities.
So, the researchers did something that a number of other scholars have done in addressing similar questions related to a government’s or organization’s disbursement of financial awards. They simulated how different disbursement mechanisms affected the distribution of awards and summarized any systematic disparities in awards received that emerged.
I won’t summarize all their findings here, but I encourage anyone interested to read the full report. Instead, I want to use this post as an opportunity to flesh out a much more stylized and abstract exercise in equity that not only speaks to the question of award disbursement, but also to the effect disbursement mechanisms have on awardee outcomes: namely, survival, which is linked more generally to the issue of efficiency.
This issue is something that is difficult to tease out in practice. We might imagine how certain disparities in awards received affect outcomes, but measurement poses a severe impediment.
This is a situation where mathematical modeling can help. By developing a stylized model we can imagine counterfactuals that can’t be observed in an empirical setting.
Below, I introduce such a model, describe alternative lottery mechanisms, and illustrate how to do this with some R code.
A Counterfactual Model of Small Business Survival
I begin by introducing the model. Suppose a population of N small businesses indexed i = 1, …, N. And, suppose there is some organization (government or private, it doesn’t matter for this exercise) that has M awards it has to decide how to allocate among the N businesses.
Each business has a set of counterfactual outcomes, namely, their likelihood of survival with and without an award. If i receives an award, its probability of survival is πia, while its probability of survival is πin ≤ πia without an award. We say i’s revealed probability of survival given whether it does or does not receive an award, denoted Ai ∈ {0, 1}, is
πi = Aiπia + (1 − Ai)πin.
Now, the organization tasked with distributing awards has a problem. The number of possible awardees exceeds the number of available awards (M < N). Because of this scarcity, some businesses will receive an award while others will have to be excluded. Clearly, it would be best if all businesses receive an award since each business does at least as well or better with an award than without.
The question is, how to choose who does and doesn’t get an award?
At the heart of this question is the tension between equity and efficiency. On the one hand, it is desirable that all businesses have an equal opportunity to receive a financial award. On the other hand, some businesses may benefit more from receiving an award than others. Thus, an equitable lottery may not produce the best net social benefit.
This is a weighty question, and I make no pretense to know what the morally right decision to make is. I also don’t think this is an appropriate end of mathematical modeling.
Rather, I think this exercise is best suited to clarifying the trade-offs between equity and efficiency.
In particular, consider four set-ups. First, suppose the organization giving out awards decides to implement a lottery. However, in designing this lottery, it may choose whether to institute a fair lottery where each business has an equal likelihood of getting an award, or else the organization may choose to implement one of three weighted lotteries where businesses receive differential likelihoods of being awarded depending on some set of criteria. For one lottery, the criterion is based on how much a business benefits from an award:πia − πin. The next assigns weights based on the anticipated likelihood of survival with an ward: πia. The final weighted lottery is based on the likelihood of business failure without an award: 1 − πin.
In reality, it’s unlikely that the organization disbursing awards has perfect information about these survival probabilities. But, for this example we’ll pretend as if it does, if only to make stark the distributional and survival impact of the alternative lotteries.
For the fair lottery, each business’s probability of receiving an award is simply:
αifair = M/N.
This is because there are M available awards and N total businesses. Say N = 100 and M = 5. If the lottery were to be repeated indefinitely, each business would get an award in 0.05 proportion of lotteries.
For each of the weighted lotteries, weights are assigned that are proportional to the criteria defined above. Respectively:
- selection on improvement (SOI): ωi ∝ πia − πin;
- selection on survival (SOS): ωi ∝ πia;
- selection on failure (SOF): ωi ∝ 1 − πin.
For each set of weights, the probability of an award is then defined as
αi = M(ωi/Σiω).
Now, there is a slight technical problem with the above. This formulation is simply the weighted average of awards received per business in successive lotteries. While these are constructed such that no more than M awards will ever be disbursed, it is possible in theory for some businesses to receive more than one award. We could take a number of approaches to putting a ceiling on the weights to avoid this happening, but in the simulation to follow this isn’t an issue.[1]
Now, with these lotteries defined, in the next section I illustrate the implications of these alternative approaches. I do so with a special eye towards not only efficiency vs. equity, but also disproportional benefits to underserved vs. non-underserved businesses. The latter are not explicit categories in the model but are nonetheless real-world characteristics of businesses that we might imagine (and that do) affect survival with and without financial support. Minority, women, veteran, and disabled owned businesses have been highlighted as particularly susceptible to negative shocks induced by the Covid-19 pandemic. For this reason, ensuring such businesses have access to pandemic relief has been a concern for both researchers and policymakers. While the highly stylized model presented here does not explicitly factor in such back-ground characteristics, we can easily imagine that businesses with a lower probability of survival without a loan are analogous to underserved businesses. By summarizing how different lotteries systematically benefit or neglect these businesses we can gain intuitions for how underserved status might be associated with disproportionate inclusion or exclusion from financial support in applied settings.
A Simulation
With the model defined, let’s take it for spin. We can easily program a simulation in R to see how different lotteries affect both small business survival and the distributional consequences thereof.
I’ll need the following packages:
library(seerrr)
library(estimatr)
library(tidyverse)
library(kableExtra)
Next, to make life easier, I define a helper function that returns the expected survival of a business given its probability of getting an award and its probability of survival with and without said award.
# Define a function to report expected survival:
p <- function(a, pa, pn) {
  a * pa + (1 - a) * pn
}
I now define the data-generating process. To keep things simple, suppose N = 100 and M = 15. Further, assume that probability of survival without financing follows a uniform distribution
πin ∼ 𝒰(0, 1),
and that survival with a loan is
πia ∼ min [πin+𝒰(0,1),1].
We can specify this in R as follows. Using simulate from the seerrr
package, we’ll choose iterate the data-generating process 100 times (we
could do more if we wanted):
sim <- simulate(
  R = 100, # No. of iterations
  N = 100, # No. of businesses
  M = 15,  # No. of awards

  # Prob. of survival without an award
  pn = runif(N),

  # Prob. of survival with an award
  pa = sapply(pn + runif(N),
              function(x) min(x, 1)),

  # Probabilities under alternative lotteries
  a_fair = M / N,
  a_soi = (pa - pn) / sum(pa - pn) * M,
  a_sos = pa / sum(pa) * M,
  a_sof = (1 - pn) / sum(1 - pn) * M,

  # Expected outcomes
  p_fair = p(a_fair, pa, pn),
  p_soi = p(a_soi, pa, pn),
  p_sos = p(a_sos, pa, pn),
  p_sof = p(a_sof, pa, pn)
) %>% bind_rows()
The above produces 100 different datasets simulated from the data generating process and then stacks them on top of each other.
First, let’s explore the results with respect to the distributional consequences of alternative lotteries. To do this, I do some data cleaning and reshaping:
sim %>%
  select(contains("a_"), pn) %>%
  pivot_longer(
    !pn, names_to = "lotto", names_prefix = "a_"
  ) %>%
  mutate(
    lotto = toupper(lotto),
    sim = rep(1:100, each = n() / 100)
  ) -> plot_smry
I then plot for each lottery the probability of receiving an award over the probability of survival without an award. I’ve also layered on LOESS lines grouped by iteration.
ggplot(plot_smry) +
  aes(
    x = pn,
    y = value,
    group = sim
  ) +
  geom_point(
    col = "grey",
    alpha = 0.1
  ) +
  stat_smooth(
    geom = "line",
    alpha = 0.2
  ) +
  facet_wrap(
    ~ lotto
  ) +
  theme_bw() +
  labs(
    x = "Survival without Support",
    y = "Pr(Award)",
    caption = "Results after 100 Simulations"
  )
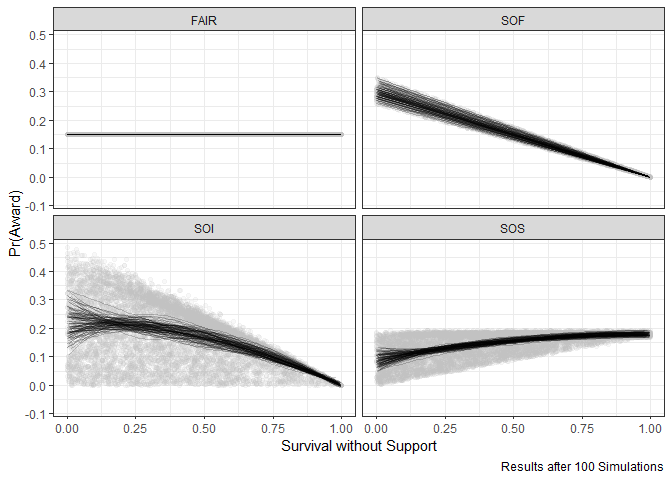
As we would expect, the fair lottery gives each business the same probability of receiving financing regardless of its characteristics (in this case, survival probability without an award). We do, however, see disparities across the other weighted lotteries.
The lottery that selects on survival with an ward (SOS) disproportionately benefits businesses that also happen to be better off without an award. Conversely, the lottery that weights more toward businesses that are likely to fail without an award (SOF), unsurprisingly, disproportionately benefits businesses with a lower probability of survival without an award. Meanwhile, the lottery that gives greatest weight to businesses that would most benefit from an award (SOI) also advantages businesses with a lower probability of survival without an award, but the results are less stark than with SOF.
The fact that SOS clearly disadvantages businesses that are worse off without an award is a point worth returning to. As the OES report highlights, in practice many lenders took a similar approach in disbursing financing. It was believed that weighting on survival with an award was the most efficient approach given the limited resources available to organizations. This approach, unfortunately, came at the expense of underserved businesses.
Was this intuition correct? Was weighting in favor of businesses deemed most likely to survive with an award the most efficient approach?
To see how the different lotteries affected survival, I first clean the data as follows:
sim %>%
  select(sim, ID, contains("p_")) %>%
  pivot_longer(
    cols = starts_with("p_"),
    names_to = "Lottery",
    names_prefix = "p_"
  ) %>%
  mutate(
    clust_var = paste0(ID, sim, sep = "_")
  ) -> out_df
The above puts the data in a convenient shape for regression analysis. In particular, we can estimate how individual businesses did under each of the weighted lotteries relative to the fair lottery. Do do this I estimate a regression model where the outcome is survival probability under different lotteries, the predictors of interest are indicators for each of the weighted lotteries, and where we control for business ID and simulation iteration to ensure estimates reflect within business, within simulation differences. Finally, standard errors are clustered by business-simulation.
diff_by_lotto <-
  lm_robust(
    value ~ Lottery,
    fixed_effects = ~ ID + sim,
    clusters = clust_var,
    data = out_df,
    se_type = "stata"
  )
The results can be summarized as in the below table:
tidy(diff_by_lotto) %>%
  select(
    term, estimate, conf.low, conf.high
  ) %>%
  mutate_if(
    is.numeric,
    ~ round(.x * 100, 3)
  ) %>%
  mutate(
    CI = paste0("[", conf.low,", ", conf.high, "]"),
    term = str_remove(term, "Lottery") %>%
      toupper()
  ) %>%
  select(-conf.low, -conf.high) %>%
  kable("markdown",
        col.names = c("Lotto", "Estimate", "95% CI"))
| Lotto | Estimate | 95% CI |
|---|---|---|
| SOF | 1.211 | [1.146, 1.275] |
| SOI | 2.447 | [2.34, 2.554] |
| SOS | 0.261 | [0.238, 0.285] |
The point estimates reflect the percentage point increase in the likelihood of survival under one of the weighted lotteries relative to the fair lottery. As it turns out, each of the weighted lotteries is more efficient than the fair lottery. This partly confirms the intuition that weighting in favor of businesses that are most likely to survive with an award is more efficient than a fair, unweighted lottery.
However, among the weighted lotteries SOS yields the least improvement. In fact, the best strategy is SOI followed by SOF. What is interesting about these results is not only that each of those lotteries is more efficient than favoring businesses that are most likely to survive with financing, but also that each is weighted in favor of underserved businesses.
Let me repeat, weighting in favor of businesses that are most likely to survive with a loan is not the most efficient solution. On average, business survival is most improved by lotteries that also disproportionately benefit disadvantaged businesses.
That’s an interesting finding, and one that probably deserves more study than what I can muster in a single blog post.
[1] It’s always good to save a little something for another day I suppose.